Synthetic Tabulation Walkthrough
This vignette uses only the seeded fixture bundle under tests/fixtures/synthetic_trial_data/. It is safe to publish, safe to run in CI, and representative of the file shapes emitted by ingest_tabulate and ingest_export.
Workflow map
flowchart LR
    SS["samplesheet.csv"]
    IM["INGEST_METADATA\nmetadata.csv"]
    TAB["TABULATE\nsubjectIdTable.csv"]
    ING["INGEST\nSeurat RDS"]
    EXP["EXPORT_COUNTS\n10x-like count dir"]

    SS --> IM --> TAB
    SS --> ING --> EXP
Fixture bundle
sample_metadata.csv: seeded cell-level metadata used to emulate the metadata-only ingest path.subjectTable_TB.csv: seeded subject-level summary table used to emulate the tabulation output.sample_counts/: seeded 10x-like export containingmatrix.mtx,features.tsv,barcodes.tsv, andobs_meta.csv.
The companion R Markdown notebook is example_tabulation_script.rmd in the repository root.
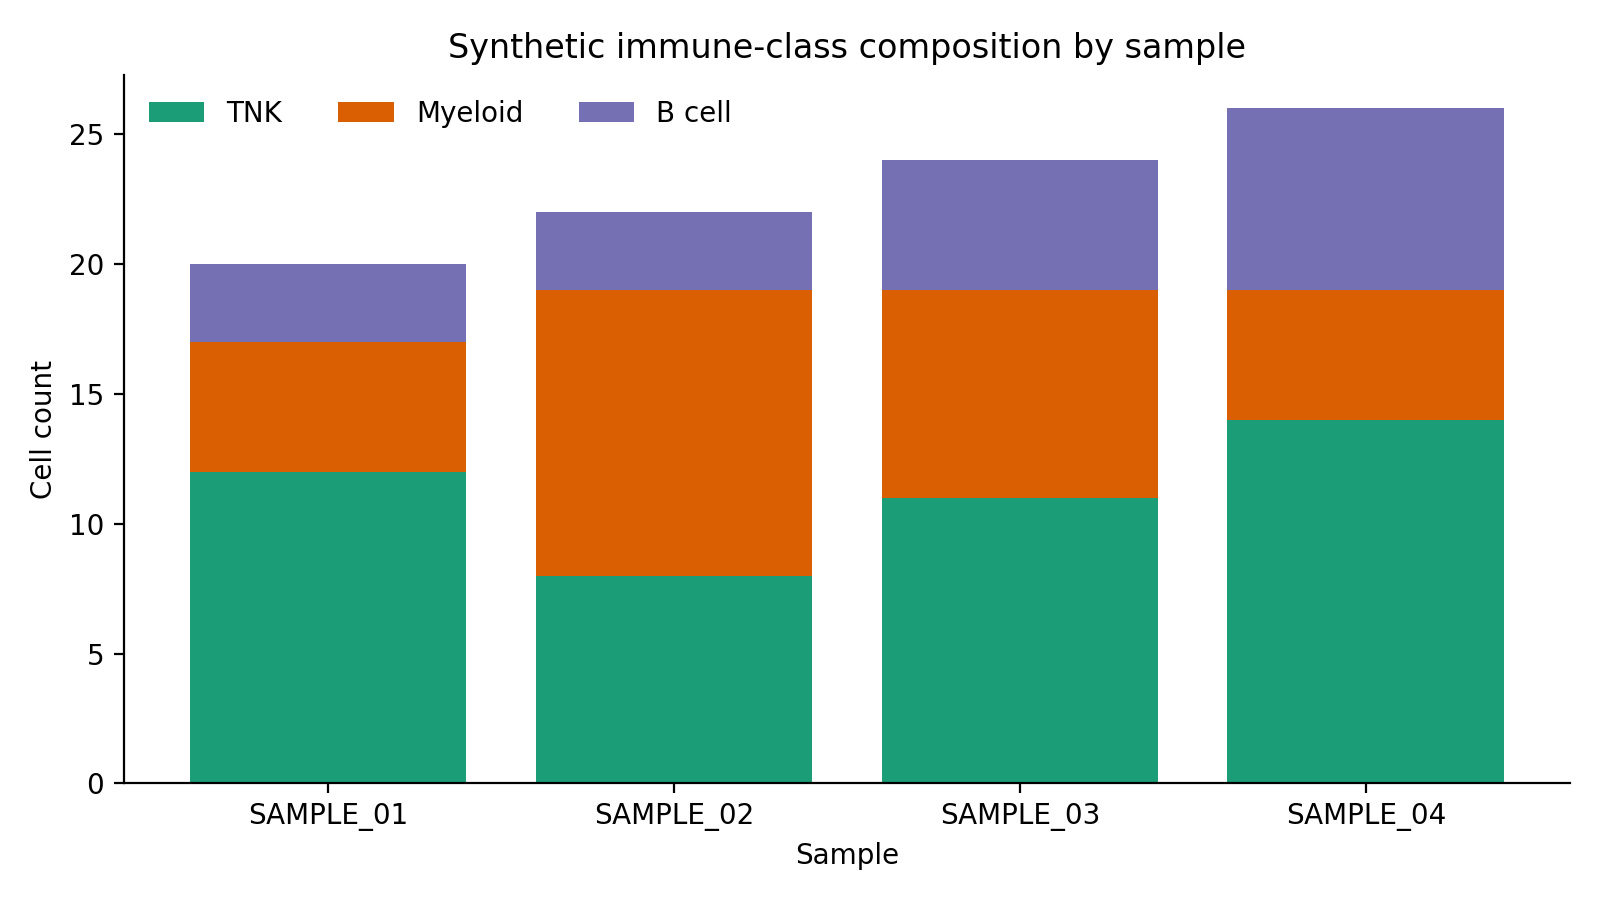
Example metadata output
The first synthetic plot shows the broad immune-class mix per sample after metadata ingest.
Representative subjectTable_TB.csv rows:
cDNA_ID,SubjectId,Group,Timepoint,Tissue,TNK_Fraction,Myeloid_Fraction,Activated_TCell_Fraction,Neutrophil_Fraction
SAMPLE_01,SUBJ_01,BCG,Day 7,Lung-R,0.60,0.25,0.29,0.05
SAMPLE_02,SUBJ_02,BCG,Day 28,Lung-L,0.36,0.50,0.29,0.27
SAMPLE_03,SUBJ_03,RhCMV,Day 7,BAL,0.46,0.33,0.24,0.21
SAMPLE_04,SUBJ_04,Control,Mock,Lung-R,0.54,0.19,0.35,0.12
Example tabulation output
The tabulation step pivots those metadata proportions into a subject-level matrix.
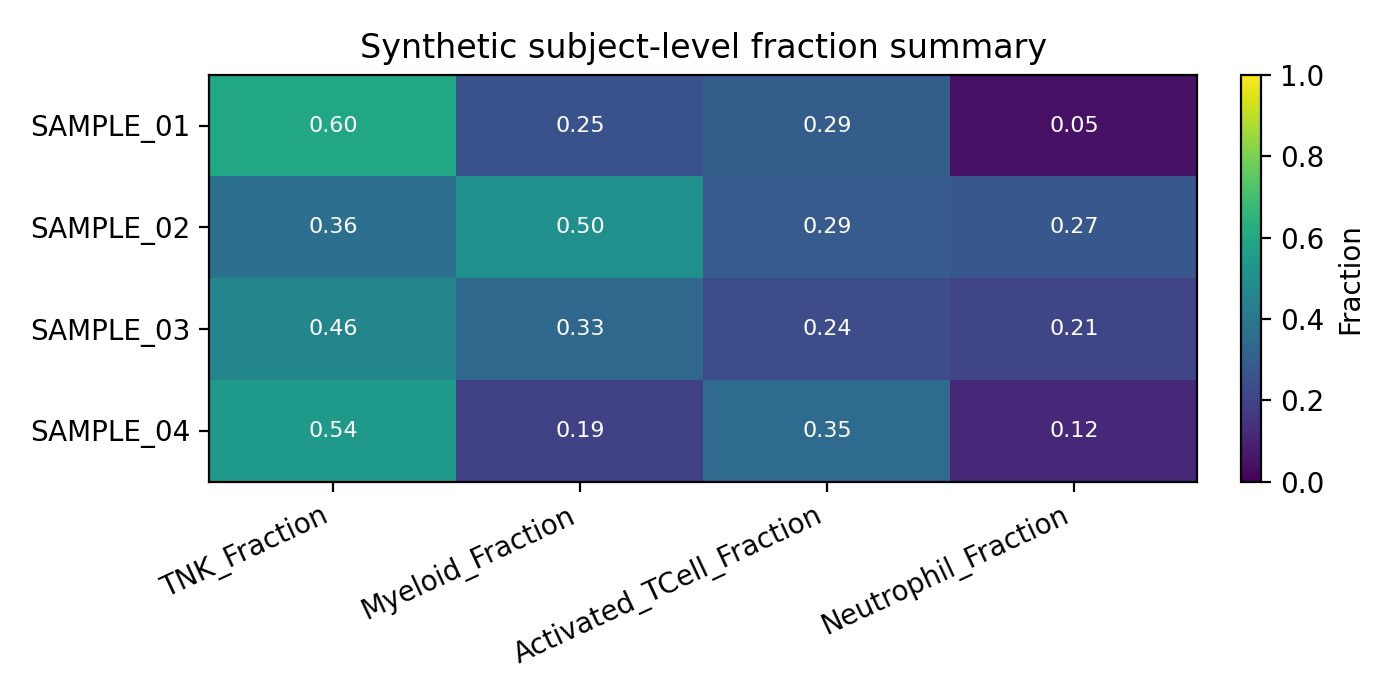
This is the format downstream notebooks should expect from outputs/tabulate/subjectIdTable.csv.
Example count export
The export workflow produces a 10x-like directory that can be read by Seurat, Scanpy, or BPCells.
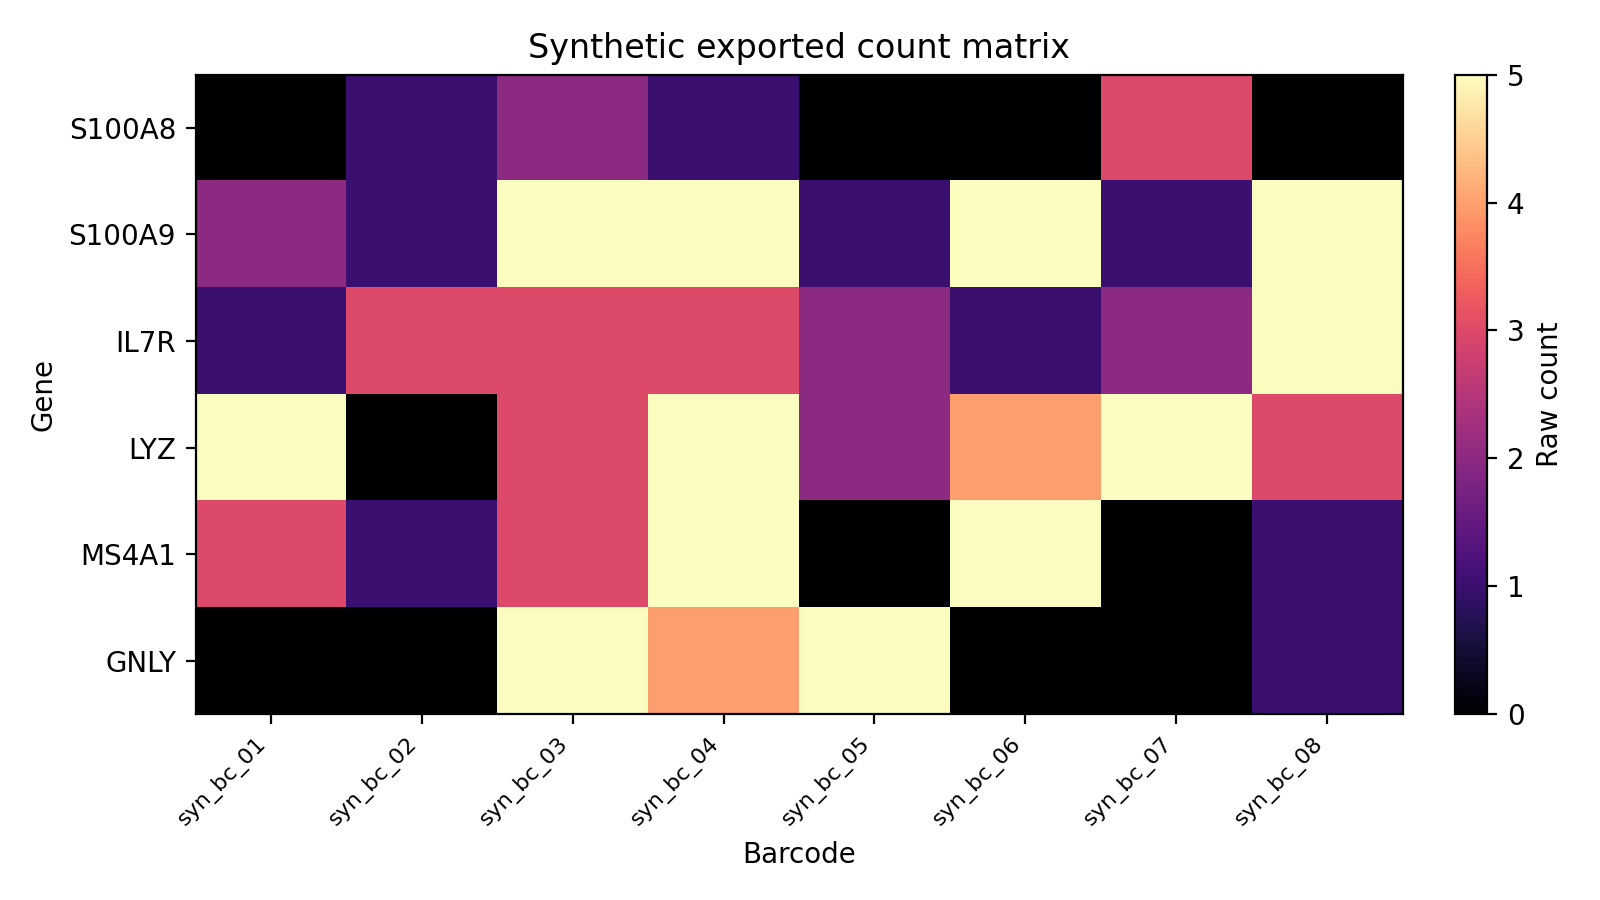
That directory contains:
matrix.mtxfeatures.tsvbarcodes.tsvobs_meta.csv
Rebuild locally
Regenerate the seeded bundle and refresh the docs assets with:
Rscript tests/fixtures/simulate_trial_data.R \
  --output-dir tests/fixtures/synthetic_trial_data \
  --target all \
  --seed 20260414

uvx --with matplotlib python scripts/docs/generate_example_plots.py
bash scripts/docs/generate_api_docs.sh
mkdocs build --strict
The generated API pages are available under API Reference.